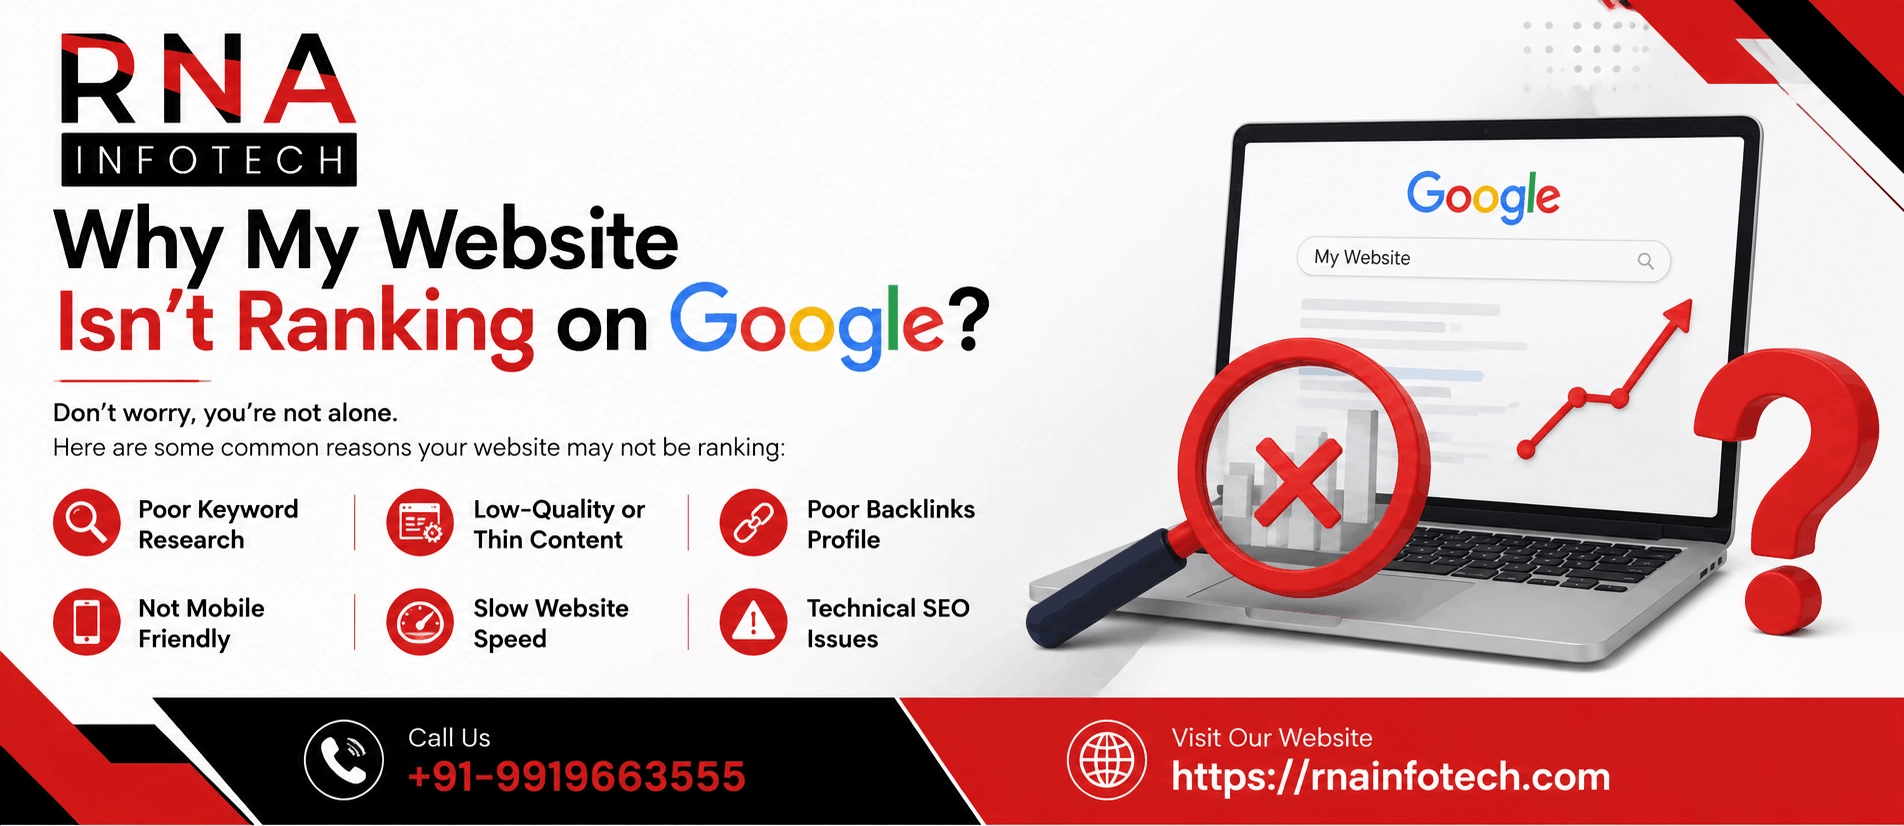


Most brands post on social media every day, but very few actually check whether those posts are working. They post, hope for likes, and move on to the next one. This is the biggest reason why social media results stay flat for so many businesses.
The truth is simple: social media without analytics is just guessing. Every post, story, and reel you publish creates data — how many people saw it, how many engaged, how many clicked, and how many became customers. When you read this data correctly, you stop guessing and start growing.
In this guide, we will show you exactly how to use analytics to improve your social media performance — step by step, in plain language. Whether you run a small business page or manage social media for a large brand, this guide will help you make smarter decisions with your content, budget, and time. As a digital marketing company that manages social media for brands across India, RNA Infotech has seen firsthand how the right use of data can turn an average social media account into a strong business channel.
When brands don't track analytics, they keep repeating the same mistakes. They post at the wrong time, use the wrong format, and target the wrong audience — without even knowing it. Over months, this wastes a lot of time, money, and effort with very little to show for it.
Analytics fixes this problem. It tells you clearly what is working and what is not, so you can put your energy into things that actually bring results.
Every number on your social media management services dashboard tells a story about your audience:
Once you understand these patterns, you can create content that your audience actually wants to see — not content you assume they will like.
Social media analytics is the process of collecting and studying data from your social media accounts — such as reach, engagement, clicks, and sales — to understand how your content and campaigns are performing.
Many people confuse vanity metrics with business metrics. Likes and followers look nice on a report, but they don't always mean your business is growing. Business metrics — like website visits, leads, and sales from social media — show the real impact of your efforts. A good social media marketing or social media strategy tracks both, but gives more weight to the numbers that affect your bottom line.
Before you check any report, decide which Key Performance Indicators (KPIs) matter for your goals. Here are the most important ones, explained simply.
| Metric | What It Tells You | Why It Matters |
|
Reach & Impressions |
How many people saw your post |
Shows visibility and brand awareness |
|
Engagement Rate |
Likes, comments, shares compared to reach |
Shows how interesting your content is |
|
Click-Through Rate (CTR) |
How many people clicked your link |
Shows how well your content drives action |
|
Conversions & ROI |
Sales or leads from social media |
Shows real business value |
|
Follower Growth & Retention |
New followers vs. people unfollowing |
Shows long-term audience quality |
If your reach is low, even the best content won't help you. Track this metric first to check whether your posts are reaching enough people.
Engagement rate is calculated as:
Engagement Rate = (Total Engagements ÷ Reach or Followers) × 100
A higher engagement rate means people find your content valuable enough to interact with it.
CTR shows how many people took the next step after seeing your post — such as visiting your website or product page. This is one of the strongest signs that your content is not just entertaining, but also useful.
This is the metric that matters most to business owners. It answers one simple question: Is social media actually bringing in money?
ROI Formula: (Return − Investment) ÷ Investment × 100
A page gaining 1,000 low-quality followers is not as valuable as a page gaining 200 followers who genuinely engage and buy. Track follower quality, not just follower count.
You don't need to be a data expert to read analytics. The right tools do most of the work for you.
Every major platform like meta business suites, instagram, and others gives you a free, built-in dashboard:
These are great for quick, day-to-day checks.
For a deeper, cross-platform view, third-party tools work better:
Every brand is different, so a one-size-fits-all tool rarely works. At RNA Infotech, we study a client's goals, budget, and platforms first, then recommend a combination of native and third-party tools that gives the clearest, most affordable picture of performance — without overwhelming the team with unnecessary data.
Here is a simple, repeatable process you can follow every month.
Decide what success looks like: more website traffic, more leads, more sales, or more brand awareness. Your KPIs should match this goal.
Check your last 30-60 days of posts. Note down reach, engagement, and clicks for each platform to understand your starting point.
Sort your posts by performance. Look for patterns:
Instead of guessing, test two versions of a post — different captions, images, or posting times — and compare the results. Over time, small tests like these add up to big improvements.
Many brands assume the "best time to post" without checking their own audience data. Your analytics dashboard shows exactly when your followers are online — use that instead of general advice.
If Instagram brings you the most sales but LinkedIn brings almost none, shift more of your time and budget toward Instagram. Let the data — not personal preference — decide where you invest.
Data is only useful when it leads to action. Here's how brands apply it in real situations:
Analytics tools today do much more than show numbers — they help predict what will happen next.
Modern tools can study patterns in your data and suggest upcoming trends, so you can create content before your competitors do.
Instead of manually pulling numbers from five different platforms, automated dashboards combine everything in one place and update in real time — saving hours of manual work every week.
Avoid these common mistakes that reduce the value of your analytics efforts:
A good report should be simple and focused on decisions, not just numbers. Include:
Reporting cadence: Use weekly reports for quick checks and monthly reports for deeper strategy reviews.
Reading analytics correctly takes time, tools, and experience — and most businesses don't have the bandwidth to do it well alongside daily operations. At RNA Infotech, we help brands set up the right tracking, read the numbers that matter, and turn insights into a social media strategy that actually grows your business.
If you want a social media presence backed by real data instead of guesswork, our team is ready to help.


FAQs provide quick answers to common queries, enhancing user experience and reducing support requests. They streamline information dissemination efficiently.
Check your key metrics weekly for quick adjustments, and do a deeper review monthly to spot long-term trends and plan strategy changes.
A good engagement rate is generally between 1% and 5%, depending on the platform and industry. Compare your rate with your own past performance and close competitors for a more accurate benchmark.
It depends on your needs. Native tools like Instagram Insights work well for quick checks, while third-party tools like Sprout Social or Google Analytics are better for tracking multiple platforms and website conversions together.
Track your total investment (ad spend, tools, staff time) against your returns (sales, leads, or value generated), then use the formula: (Return − Investment) ÷ Investment × 100.
A small business should start with reach, engagement rate, and website clicks, since these show whether people are seeing and responding to content. Once these basics are steady, move on to conversions and ROI tracking for a fuller picture of business impact.
Most brands start noticing useful patterns within four to six weeks of consistent tracking, since this gives enough posts and audience interactions to compare. Bigger strategy shifts, like changing content pillars or posting schedules, usually show clearer results after two to three months.
Yes, most analytics tools let you track competitor pages for reach, engagement, and posting frequency, which helps you see how you compare in your industry. This information is useful for spotting content gaps and finding opportunities your competitors may have missed.
Free dashboards like Instagram Insights or Meta Business Suite work well for small businesses managing one or two platforms with simple goals. If you manage multiple platforms, run paid ads, or need detailed reporting for a team, a paid tool saves time and gives deeper insights.
Reach tells you how many unique people saw your post, while engagement tells you how many of them actually interacted with it through likes, comments, shares, or saves. A post can have high reach but low engagement, which usually means the content did not truly interest the audience.
By reviewing your top-performing posts over time, you can spot common patterns in topic, format, and tone that consistently attract attention. These patterns become a reliable guide for planning future content instead of relying on trial and error every time.
No, each platform has different strengths, so the metrics that matter most can differ. For example, LinkedIn is often judged by lead quality and professional engagement, while Instagram is judged more by visual engagement, saves, and story views.
Your strategy is working if you see steady improvement in the metrics tied to your original goal, such as rising conversions, better engagement rates, or lower cost per lead over time. It also helps to compare your current numbers with your own past performance every month rather than judging results in isolation.
Yes, an experienced agency like RNA Infotech can set up the right tracking systems, read the data correctly, and turn it into a clear action plan for your brand. This saves business owners time and often leads to better results, since agencies bring hands-on experience across many industries and platforms.

RNA INFOTECH
Online👋 Hi there
How can I help you today?
Please Provide Details below:
Your Name:
Requirements: